Arctic heat waves cause exceptional Greenland melt, says new
N_Fiddledog @ Fri Apr 08, 2016 12:28 pm
DrCaleb DrCaleb:
I might be old, but my memory is pretty good still. 
Well I'll take your word for it about the memory, but your cognizance may be off more than a bit.
Either that or I don't understand you.
Somebody thought there was cooling. You said I tried to sell that. I called bullshit.
You sent me to a link where I'm talking about the climate pause, not cooling.
And you were hella smug about it too.
So do better than that or once more, 'Bullshit.'
Zipperfish @ Fri Apr 08, 2016 12:30 pm
N_Fiddledog N_Fiddledog:
That's True, but remember the days when nobody cared much about the winter ice? It was always about the Summer minimum.
Now it's 'OMG the ice is low in the winter, we must run and tell the king.'
But let's wonder why we're not concerned about the summer minimum anymore.
Remember when the summer Minimum set a record in 2012? OMG!
[video]https://www.youtube.com/watch?v=JmzuRXLzqKk
[/video]
But then the next year there was a record rebound of ice in the summer minimum. Biggest ever. (ever being the 30 year satellite record, of course, but when it's warming that's never mentioned, so what the Hell)
And we stopped hearing about the Summer minimum. Now it's OMG the Winter...the winter...it's only about the winter. Never before. Faster, stronger, higher, lower, warmer colder, never before seen.
But let's look at the graph.
http://ocean.dmi.dk/arctic/icecover.uk.php
Notice how this year is following last year and notice the summer minimum was a little low, but no big deal last year.
And let's remember we're coming out of two consecutive El Nino years before we start running screaming down the streets from shadows of Manbearpig.
Come to think of it don't you follow ENSO? I heard it's starting to look like it may be flipping into La Nina. How credible do you find that?
Because if it happens not even the data rewriters at NOAA are going to be able to find any more of these "warmest months ever."
If you look at the graph you posted you can see that all 4 recent years posted are be below the average for sea ice, which is consistent with the idea that sea ice is declining.
I know all about ENSO. It consists of El Nino, when all the alarmists increase their volume, followed by La Nina, when all the deniers increase their volume.
I'm not guessing on La Nina. They don't know. Look at this El Nino--it was "Oh there might be an El Nino", followed by "looks like a weak to moderate El Nino", "followed by "strong to moderate El Nino." And then it turns out we actually had quite a strong El Nino, though not as strong as the 1998 one, I don't think.
N_Fiddledog @ Fri Apr 08, 2016 12:40 pm
Yes, I already said the ice is still a little low. My point was there was a bounce back in the Summer Minimum and all of a sudden summer no longer matters. Now it's all about the winter.
And yeah, I'll admit to watching for La Nina and smile at how quiet the "WARMEST MONTH EVER! ![]() " Chicken Littles are going to get.
" Chicken Littles are going to get.
Cause it's all about the CO2, don't ya know. ![]()
DrCaleb @ Fri Apr 08, 2016 12:42 pm
uwish uwish:
I am not looking at anything graphic you have posted, I don't know the source, I will only take it from the source.
2: https://en.wikipedia.org/wiki/Temperature_record
3: https://www3.epa.gov/climatechange/kids ... proof.html
4: https://en.wikipedia.org/wiki/Instrumen ... ure_record
uwish uwish:
Land based thermometer readings are faulty and erroneous, I don't and will not look at that data.
Cherry picking. Land based measurements are the most accurate.
The Berkeley Earth Project (http://berkeleyearth.org/) had the same concerns as you. They analyzed the data sets many different ways, including excluding erroneous data. The results may surprise you.
http://berkeleyearth.org/summary-of-findings/
uwish uwish:
If it isn't ice cores, or satellite data don't bother.
Well, that 800,000 years of data is reconstructed form ice cores. But I'm having a little trouble finding ice core data from 2015/2016. So I'm afraid that land based measurement will have to do.
Here's some Satellite data until we can get those ice cores for you.
http://climate.nasa.gov/news/2264/
http://climate.nasa.gov/
http://phys.org/news/2016-03-revamped-s ... lobal.html
https://www.ncdc.noaa.gov/monitoring-re ... arming.php
uwish @ Fri Apr 08, 2016 12:45 pm
really not cherry picking by excluding land based temp readings. They use the US dataset for most of it and those are the most prone to error. Have you seen them? they are greatly affected by micro climates, they are on roof tops in the city, by AC units etc. This is not an accurate measurement of surface temperature. That is why they should be excluded, it just isn't reliable.
DrCaleb @ Fri Apr 08, 2016 12:45 pm
N_Fiddledog N_Fiddledog:
DrCaleb DrCaleb:
I might be old, but my memory is pretty good still.
Well I'll take your word for it about the memory, but your cognizance may be off more than a bit.
Either that or I don't understand you.
Somebody thought there was cooling. You said I tried to sell that. I called bullshit.
You sent me to a link where I'm talking about the climate pause, not cooling.
And you were hella smug about it too.
So do better than that or once more, 'Bullshit.'
Nice try, but everyone is able to follow that link.
$1:
Title: Climate change shock: Burning fossil fuels COOLS planet, says NASA
Category: Environmental
Posted By: N_Fiddledog
Category: Environmental
Posted By: N_Fiddledog
Clearly, nothing about the 'pause'.
$1:
What global warming? Alaska is headed for an ice age as scientists report state's steady temperature decline
Again, the second link was not about any 'pause'. The title is quite clear.
Nice dodge though!
DrCaleb @ Fri Apr 08, 2016 12:50 pm
uwish uwish:
really not cherry picking by excluding land based temp readings. They use the US dataset for most of it and those are the most prone to error. Have you seen them? they are greatly affected by micro climates, they are on roof tops in the city, by AC units etc. This is not an accurate measurement of surface temperature. That is why they should be excluded, it just isn't reliable.
And the Berleley project specifically excluded data that was a certain percent off neighbouring measurements, to exclude those microclimates. It made no difference to the results.
And the US data set isn't the only one, there are also sets from Canada, the UK and Japan. And they all say the same thing. As a Geologist, you understand what it means to have multiple independent data sets that agree with each other.
Trends in all data sets are the same. And they agree with the satellite trends!
I don't understand how you can see all these things, and think for a moment that they say the opposite of what they say.
uwish @ Fri Apr 08, 2016 12:52 pm
the satellite data doesn't show it. The only thing that shows it is surface based land temperature measurements. That's the point! in the sat data you can see two trends, one before the 1998 el nino and one after. Yes this year there was a peak this year, but it's just one year like it did back in 1998. Only 37 years of sat temp data...
http://www.climate4you.com/GlobalTemperatures.htm#Quality%20class%201:%20Satellite%20record%20of%20recent%20global%20air%20temperature%20change
if it isn't satellite temperature data, I don't trust it. If it isn't ice core data, I don't trust it. We need to be talking about scale, not this year or last year or even 30 years!
You do realize that it take at least 30 years of weather to be taken as a 'climate' data point right? so really, we shouldn't even be talking about this for another 30 years, at least then you will have two points the minimum it takes to draw a line! which is basically what they do with surface temps readings.
AND that doesn't negate the fact, ice cores show a sig higher CO2 concentration in the atmosphere (15 TIMES) and almost NO difference in temperature from today? hum seems to break the hypothesis to me! (that increased CO2 emissions results in dangerous global warming).
N_Fiddledog @ Fri Apr 08, 2016 1:10 pm
DrCaleb DrCaleb:
Nice try, but everyone is able to follow that link.
Clearly, nothing about the 'pause'.
$1:
Title: Climate change shock: Burning fossil fuels COOLS planet, says NASA
Category: Environmental
Posted By: N_Fiddledog
Category: Environmental
Posted By: N_Fiddledog
Clearly, nothing about the 'pause'.
My comment on the page you linked to was about the pause. If you're saying I personally am claiming global cooling then for the third time "Bullshit."
Here's what that article whose title you just posted claimed though.
$1:
Environmentalists have long argued the burning of fossil fuels in power stations and for other uses is responsible for global warming and predicted temperature increases because of the high levels of carbon dioxide produced - which causes the global greenhouse effect.
While the findings did not dispute the effects of carbon dioxide on global warming, they found aerosols - also given off by burning fossil fuels - actually cool the local environment, at least temporarily.
While the findings did not dispute the effects of carbon dioxide on global warming, they found aerosols - also given off by burning fossil fuels - actually cool the local environment, at least temporarily.
And concerning the second link - again that is not me claiming global cooling. It is not even the claim of the newspaper article whose title you again posted trying to insinuate the claim is mine.
Their claim is as follows. Notice their story is just about a decade long trend in Alaska
$1:
New research from the Alaska Climate Research Center shows that since the beginning of the 21st century, temperatures in the snow covered land of Alaska are actually getting colder - bucking the overall global warming trend.
In the Last Frontier, where temperatures can get as cold as 50 degrees below zero, local residents have experienced the increasing chill and scientists now confirm that the Northwest state is indeed seeing a temperature drop.
In the Last Frontier, where temperatures can get as cold as 50 degrees below zero, local residents have experienced the increasing chill and scientists now confirm that the Northwest state is indeed seeing a temperature drop.
So if you are saying I personally am claiming some sort of global cooling trend then for the fourth and I would hope final time, 'Bullshit!'
Zipperfish @ Fri Apr 08, 2016 1:32 pm
DrCaleb DrCaleb:
uwish uwish:
really not cherry picking by excluding land based temp readings. They use the US dataset for most of it and those are the most prone to error. Have you seen them? they are greatly affected by micro climates, they are on roof tops in the city, by AC units etc. This is not an accurate measurement of surface temperature. That is why they should be excluded, it just isn't reliable.
And the Berleley project specifically excluded data that was a certain percent off neighbouring measurements, to exclude those microclimates. It made no difference to the results.
And the US data set isn't the only one, there are also sets from Canada, the UK and Japan. And they all say the same thing. As a Geologist, you understand what it means to have multiple independent data sets that agree with each other.
Trends in all data sets are the same. And they agree with the satellite trends!
I don't understand how you can see all these things, and think for a moment that they say the opposite of what they say.
All the data sets are imprecise and inaccurate to some extent, clearly. The satellites aren't all that--it's remarkable the level of mathematical manipulation you have to go through to turn a measurement of radiance in various wavelength bands at various altitudes into temperatures. Surface temperatures probably have the most errors, but then they also have the most data, so that mitigates things substantially.
I agree with Dr. Caleb that, given all the sample sets we have at our disposal, the recent warming (last 150 years or so) is pretty robust. And yes, the satellite record (both UAH and RSS) show a warming trend since 1979 that correlates well with the surface temperature record.
DrCaleb @ Mon Apr 11, 2016 5:51 am
Zipperfish Zipperfish:
DrCaleb DrCaleb:
I think I read somewhere that not only was February 2016 the hottest of the 137 Februaries recorded, it was also hotter than 134 of the recorded March averages.
Pretty much the height of El Nino, so I don't expect those kind of anomalies will continue past March or April. Wonder if we'll see La Nina this year?
I hope so. Two years of drought, and this past winter where it barely snowed at all. We could use the rain.
DrCaleb @ Mon Apr 11, 2016 6:12 am
uwish uwish:
the satellite data doesn't show it. The only thing that shows it is surface based land temperature measurements. That's the point! in the sat data you can see two trends, one before the 1998 el nino and one after. Yes this year there was a peak this year, but it's just one year like it did back in 1998. Only 37 years of sat temp data...
http://www.climate4you.com/GlobalTemperatures.htm#Quality%20class%201:%20Satellite%20record%20of%20recent%20global%20air%20temperature%20change
http://www.climate4you.com/GlobalTemperatures.htm#Quality%20class%201:%20Satellite%20record%20of%20recent%20global%20air%20temperature%20change
That's the lower troposphereic temperature, not surface temperature. The problem with this measurement has always been that unlike a surface temperature reading that can be taken the same time every day, satellites can drift as they are re-positioned and that makes taking the same reading at the same spot each day problematic.
http://thinkprogress.org/climate/2016/0 ... l-warming/
uwish uwish:
if it isn't satellite temperature data, I don't trust it. If it isn't ice core data, I don't trust it. We need to be talking about scale, not this year or last year or even 30 years!
Whether you believe it or not, land based measurements are them most accurate. We know this because the satellite record matches the land record trend, and other records produced by the UK and Japan also reflect this trend. The data is verified through independent means.
uwish uwish:
You do realize that it take at least 30 years of weather to be taken as a 'climate' data point right? so really, we shouldn't even be talking about this for another 30 years, at least then you will have two points the minimum it takes to draw a line! which is basically what they do with surface temps readings.
Guy Callendar first linked carbon dioxide concentrations in the atmosphere to rising temperatures in the 1930s. At what point do we decide that there have been enough '30 year' cycles to call it a trend and start taking action?
uwish uwish:
AND that doesn't negate the fact, ice cores show a sig higher CO2 concentration in the atmosphere (15 TIMES) and almost NO difference in temperature from today? hum seems to break the hypothesis to me! (that increased CO2 emissions results in dangerous global warming).
Oxygen isotopes and Deuterium in ice core samples are what show global temperatures, not the CO2 concentrations.
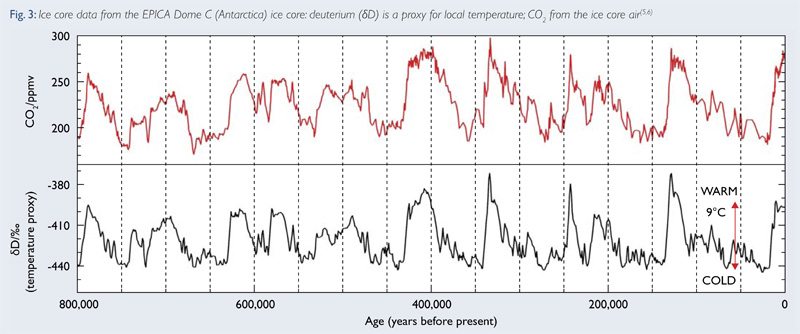
https://www.bas.ac.uk/data/our-data/pub ... te-change/
Looking at those reconstructions from the British Antarctic Society, I see nothing that is 15 times today's atmospheric concentrations.
Like Zip and I have asked, if CO2 concentrations do not contribute to global warming, then how do you explain where the heat is going?
N_Fiddledog @ Mon Apr 11, 2016 9:31 am
I'm going to post some links. At least read the first one. It's quick, easy and will introduce many to an important point climate hysterics will never tell you concerning the tropospheric versus the beyond "problematic" land based measurements.
Watts: Gavin’s admission about the satellite record versus the surface temperature record
And seeing as were using climate hysteric Joe Romm from the politically biased Think Progress, it becomes acceptable to get a reply from Christopher Monckton who clarifies the above and then goes on.
$1:
Schmidt and Karl, like the Met Office this side of the pond, say there has been rapid surface warming over the past 19 years. If so, where on Earth did it come from? The laws of thermodynamics are not up for repeal. The official theory is that CO2 warms the atmosphere and the atmosphere warms the surface. But for almost 19 years the satellites show that the lower atmosphere has barely warmed. Even if there had been CO2-driven warming higher up, for the official theory says we should expect a faster warming rate in the mid-troposphere than at the surface, how could that higher-altitude warming have magically reached the surface through a lower troposphere that has not warmed at all?
The Pause hangs on by its fingernails
The video below is fair. Hysterics will call your attention to him saying you shouldn't use an El Nino year to measure a trend, but that is where the pause comes from in the first place. That also is fair, but there is a pause between the 2 super El Ninos. At present, even by satellites it appears to be coming to an end. However, if El Nino is ending what happens now? That's the question.
But El Nino is not manmade. Here's another study Joe Romm and his ilk will never show you that calls into question the idea that the warming we have seen since was manmade by showing contradictions between predictions in the theory and reality.
https://wattsupwiththat.com/2014/08/05/ ... -14-years/
N_Fiddledog @ Mon Apr 11, 2016 9:36 am
Also:
Thus far the warming has been happening in steps. If this long term trend continues. We should now expect a .16 warming after the pause, shouldn't we? Anybody want to make that prediction, seeing as the El Nino is coming to an end?