More GLOBAL WARMING!
ziggy @ Sat Dec 20, 2008 8:14 pm
Wow! 12 graph's on this last page alone. ![]()
RUEZ @ Sat Dec 20, 2008 8:25 pm
It's -30 in PG, -25 in Kelowna. Could you imagine driving a Zenn car today? ![]()
ziggy @ Sat Dec 20, 2008 8:35 pm
RUEZ RUEZ:
It's -30 in PG, -25 in Kelowna. Could you imagine driving a Zenn car today? 
It's cold,I burnt my fingers grabbing an aluminum ladder of the deck today,took about 2 seconds and phsssssssst. I should know better.
This should kill a few beetle's.
PluggyRug @ Sat Dec 20, 2008 9:47 pm
ziggy ziggy:
RUEZ RUEZ:
It's -30 in PG, -25 in Kelowna. Could you imagine driving a Zenn car today?
It's cold,I burnt my fingers grabbing an aluminum ladder of the deck today,took about 2 seconds and phsssssssst. I should know better.
This should kill a few beetle's.
And a few of the Global Warming alarmists.
N_Fiddledog @ Sat Dec 20, 2008 11:41 pm
Zipperfish Zipperfish:
I think you're confusing scientific evidence wiht Warmist ideology. The graph in question is not a creation of Wiki editors.
You found it at wikemedia, right? Here's your link.
http://upload.wikimedia.org/wikipedia/c ... _Record.pn
$1:
It's from the UK Climatic Research Unit, whihc is a pretty esteemed climatological reserach centre. Secondly, contrary to your assertion, it does not stop in 2000.
Damn, look at that. You're right it doesn't stop at 2000. How'd I miss that? Actually I think I know. Watch I'll show you. Here's the wikimedia graph again.
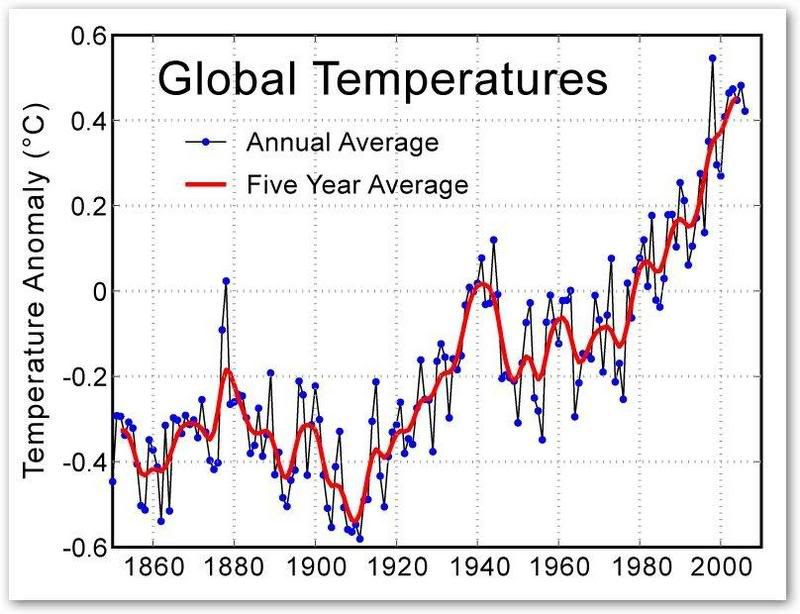
In the large version you originally posted that high, spiking slope was blowing me away a bit. I'm not used to seeing it like that. It looked so unusual, especially going straight up so high, so fast without even the tick at the end. I'm used to seeing it with a more gradual slope, and it generally levels out, or drops towards the last ten years. I was trying to figure out how they did that, and I completely missed that tiny little collection of dots at the end. Oops.
It's good though, because once I saw that, and I heard where Wikimedia is supposed to have found it I had to look for it to see what they did to make it look like such a sensationalistic spike without the customary leveling tick at the end. I went to what google tells me is the UK Climatic Research Unit, which is where you tell me Wikimedia found that graph. I could not find it myself. I did however find this.
Now that's from the site you claim the other graph is also from, and covers the same time period. Do you see the difference though? Do you see why Wikimedia chose the other graph? It's more or less the same data, but the Mickeymedia...er, pardon me Wikimedia graph, stretches the vertical, and shrinks the horizontal it gives a much more hysterical, alarming, appearance to the rise. The Wikemedia graph also somehow lost the leveling tick at the end one usually sees. Don't know how they did that one.
$1:
yes, it has warmed 0.7 deg over the past 100 years.
And again so what? If we were looking at that rise over the scale of geologic time, it wouldn't even show up. Here's an interesting one...
January 2007 to January 2008
The drop in global temperature from January 2007 to January 2008 was almost equal to the entire rise in temperature over the 20th century. That little factoid has no real significance maybe. However it shows how quick you can get a global rise, or fall of 0.7 of a degree more or less, and allows one to ponder on its significance no matter what sort of sensationalized graph can be found at Wiki to scream it out there.
Oh, and "scientific evidence"? Yeah right. Let's see some of that. Perverted, sensationalized, graphs, are just tricks to fool the rubes.
Zipperfish @ Sun Dec 21, 2008 11:13 am
N_Fiddledog N_Fiddledog:
Oh, and "scientific evidence"? Yeah right. Let's see some of that. Perverted, sensationalized, graphs, are just tricks to fool the rubes.
The graph you posted shows exactly the same thing as the graph I posted--a distinct warming trend. The data remain the same regardless of how you graph it.
And again, it is difficult to make inferences about climatic trends based on the whether of one week. As a matter of fact, I would call it sensationalistic and perverted to seize upon a cold spell as proof there is no global warming.
xerxes @ Sun Dec 21, 2008 11:30 am
Which is what people do EVERY time.
mtbr @ Sun Dec 21, 2008 11:31 am
xerxes xerxes:
Which is what people do EVERY time.
agree the constant melting of Arctic ice in the summer proves nothing.
N_Fiddledog @ Sun Dec 21, 2008 12:15 pm
In fact if you take all the freaky, localized weather disturbances away from the alarmists' argument, there's not much left. A century long trend of just 0.7 of a degree which one would expect as we come out of a cold period like the Little Ice age doesn't mean much. Such trends are not unusual. If that's all you got, you ain't got much. If you want to start talking about droughts, and floods, and such though, well how come it's been so cold lately?
Zipperfish @ Mon Dec 22, 2008 10:51 am
N_Fiddledog N_Fiddledog:
If that's all you got, you ain't got much. If you want to start talking about droughts, and floods, and such though, well how come it's been so cold lately?
It's winter. It tends to be colder than summer on average.
Claimte change deals wiht long term trends, not the weather over the past week. This year is the coldest in a ecade, but it would have been warm by 1980s standard and downright balmy in Dickens's time.
N_Fiddledog @ Mon Dec 22, 2008 3:16 pm
Interesting you should bring up Dickens. That period occurred during something called the Dalton minimum which was a period of low sunspot activity. As you may have heard we appear to be entering a similar period of low sun spot activity in spite of the hopeful claims of alarmists who shout the solar cycle is changing every time they spot a Tiny Tim (small spot). We're not. The present quiet sun continues. So although we are not in anything like a Dalton minimum yet, there's reason express caution. But what does that have to do with man-made global warming?
As far as the humorous, stubborn continuation of cooling is concerned. We skeptics find it funny. We'll stop doing so when hysteric snake oil salesmen like Al Gore stop pointing to everything from the latest tsunami to the disappearance of the Loch Ness monster, and calling such events evidence of man made global warming. Or maybe not... It's been ten years of flattening global temps, to gradual cooling so far. This may very well be something more than an enjoyable oddity. Dare I say it...a trend.
Zipperfish @ Mon Dec 22, 2008 3:55 pm
$1:
As far as the humorous, stubborn continuation of cooling is concerned. We skeptics find it funny. We'll stop doing so when hysteric snake oil salesmen like Al Gore stop pointing to everything from the latest tsunami to the disappearance of the Loch Ness monster, and calling such events evidence of man made global warming. Or maybe not... It's been ten years of flattening global temps, to gradual cooling so far. This may very well be something more than an enjoyable oddity. Dare I say it...a trend.
I think both sides are guilty of taking short term significant events as indicative of long term trends, at least in the popular press.
Kerozine @ Mon Dec 22, 2008 3:58 pm
This thread needs more videos. ![[drool]](./images/smilies/droolies.GIF "Drool")
mtbr @ Mon Dec 22, 2008 4:07 pm
[quote="Kerozine"]This thread needs more videos.
I wonder who's paying science boys paycheck
Kerozine @ Mon Dec 22, 2008 4:10 pm
The petroleum industry, of course.