The USA has deep unemployment problems, same as us.
Bruce_the_vii @ Sat Mar 01, 2008 5:09 pm
_____________One Big Hoax in the USA is Official Unemployment__________
The US Census Bureau keeps detailed labour force data by city. However, the official unemployment figure is not reliable because in the modern situation people drop out of the labour force. Thus the labour force itself varies as a percent of the population. It varies by region and in the same place it varies with the business cycle. The missing element is hidden unemployment which is excluded from their survey. This is always a problem and the world over statisticians never just report the unemployment figure alone rather they report the labour force level in the adult population, that is they report the adult participation rate. Adults in the labour force are the people working but also the unemployed people actively looking for work. You are only officially unemployed if you say you are definitely looking for work in the telephone survey.
The question is what is the real unemployment - that is what is the natural rate of participation given that there is almost always some hidden unemployed. A good answer is: What is the participation rate in the few cities that approach full employment? It’s not likely that there’s variation as you have to be financial independent not to work ever. Below is the estimated real unemployment in American cities based on the standard of the best cities. While the participation data is available the world over it is not used much.
I live in Canada and in the deep recession of the 1990s at the peak of the unemployment 27 of the 27 surveyed cities had 50% to 100% of the increase in unemployment go to hidden unemployment. In no instance did the official unemployment figure catch as much as half the increase. The official unemployment figure had zero meaning in 100% of the data. Statisticians use the similar measurements of unemployment around the world.
(Technical notes. I used the figure of 74% participation as the best performance. There are three American cities near this and three Canadian cities at this. However, the best Canadian city – the Toronto suburbs in 1990, hit 79.2% so there may be room for significant improvement in the best American cities. This is as the hidden unemployed delay reentering the work force for years at a time. So my estimates are, if anything, conservative.
There can be local variation. I dropped out all Florida data because the number of retired people in some cities is very high. )
___________USA 2006 Unemployment ----100 Largest Cities _________
.*****************************************************
City¬¬..______________Official_________Adults in_______Estimated
________________Unemployment____Labour Force__Real Unemployment
__________________Percent__________Percent_________Percent
Benchmark (Madison)..__3.6____________73.7___________(3.9)
Benchmark(Des Moines)_4.2____________73.8__________(4.4)
Benchmark(Minneapolis)_5.3___________73.6___________(5.7)
.******************************************************
New York City.._______6.5_____________64.1___________(15.5)
Los Angeles.._________6.1_____________65.2___________(14.2)
Chicago.._____________7.5_____________67.6___________(13.3)
Washington..__________4.6_____________72.3___________(6.2)
San Francisco.._________6.0_____________66.5__________(12.9)
Philadelphia..__________6.8_____________66.0___________(14.1)
Boston..______________5.4_____________68.4___________(10.6)
Detroit..______________10.5_____________64.5__________(18.7)
Dallas.._______________6.7_____________70.7___________(9.7)
Houston.._____________7.3_____________68.2___________(12.5)
Atlanta..______________7.1_____________70.3___________(10.4)
Miami..______________FLA_____________FLA__________(FLA)
Seatle.._______________5.5_____________69.0___________(10.1)
Phoenix.._____________4.2_____________65.4___________(12.3)
Minneapolic..__________5.3_____________73.6___________(5.7)
Cleveland..____________6.5_____________60.4___________(18.9)
San Diego..____________5.0_____________65.9___________(12.6)
St. Louis.._____________6.6_____________66.6___________(13.3)
Denver..______________5.7_____________71.6___________(7.9)
San Juan.._____________13.6____________49.3___________(33.8 )
Tampa..______________FLA_____________FLA__________(FLA)
Pittsburgh..____________5.9_____________60.9___________(18.0)
Portland.._____________6.1_____________69.2___________(10.5)
Cinncinati..___________6.4_____________67.1___________(12.7)
Sacramento..__________6.7_____________64.7___________(15.2)
Kansas..______________5.7_____________70.4___________(9.0)
Milwaukee..___________6.1_____________68.8___________(10.9)
Orlando.._____________5.4_____________66.6___________(12.3)
Indianapolis..__________6.5_____________70.1___________(10.1)
San Antonio..__________6.7_____________64.2___________(15.6)
Virginia Beach..________4.7_____________69.5___________(8.9)
Las Vegas..____________5.3_____________67.9___________(10.0)
Columbus..____________6.4_____________69.2___________(10.8 )
Charlotte.._____________6.5_____________70.7___________(9.5)
New Orleans..__________7.9_____________61.8___________(18.8 )
Salt Lake City.._________4.4_____________72.7___________(5.6)
Greensboro..___________6.7_____________65.7___________(14.2)
Austin.._______________6.0_____________71.7___________(8.1)
Nashville.._____________5.9_____________68.4___________(11.1)
Providence..____________6.1_____________66.4___________(13.1)
Raleigh.._______________4.9_____________70.1___________(8.5)
Hartford..______________6.3_____________67.9___________(11.9)
Buffalo.._______________6.1_____________61.5___________(17.6)
Memphis.._____________9.2_____________66.3___________(15.9)
West Palm Beach..________na_____________na____________(na)
Jacksonville..____________FLA___________FLA___________(FLA)
Rochester.._____________6.4_____________63.7___________(15.8 )
Grand Rapids..__________8.3_____________68.4___________(13.3)
Oklahoma.._____________5.6_____________66.1___________(12.9)
Louisville.._____________6.8_____________65.7___________(14.3)
Richmong.._____________5.8_____________67.7___________(11.6)
Greenville.._____________7.2_____________63.7___________(16.5)
Dayton..________________6.5_____________64.4___________(15.2)
Fresno..________________9.7_____________62.2___________(20.0)
Birmingham..___________6.4_____________62.8___________(16.6)
Honolulu..______________4.7_____________65.1___________(13.0)
Albany.._______________5.4_____________66.5___________(12.4)
Tucson.._______________6.3_____________61.4___________(17.8 )
Tulsa..________________6.0_____________65.3___________(14.0)
Syracuse..______________6.8_____________63.3___________(16.4)
Omaha.._______________5.7_____________72.1___________(7.5)
Alburquerque..__________5.9_____________66.6___________(12.7)
Knoxville.._____________5.9_____________63.1___________(15.9)
El Paso.._______________8.1_____________59.0___________(21.4)
Bakersfield..____________9.2_____________61.6___________(20.1)
Allentown..____________5.4_____________64.8___________(13.9)
Lebanon..______________3.9_____________68.6___________(9.0)
Scranton..______________5.3_____________61.1___________(17.3)
Toledo.._______________8.2_____________67.2___________(14.2)
Baton Rouge..__________8.0_____________64.0___________(16.9)
Youngstown..__________8.0_____________59.9___________(20.6)
Springfield..____________7.1_____________64.8__________(15.4)
Sarasota..______________FLA_____________FLA_________(FLA)
Little Rock..___________5.5_____________66.6___________(12.35)
McAllen.._____________10.4____________59.9___________(22.5)
Stockton.._____________9.1_____________62.5___________(19.2)
Charleston..____________5.9_____________65.6___________(13.6)
Wichita..______________6.3______________69.4___________(10.5)
Mobile.._______________7.0_____________59.9___________(19.8 )
Columbia.._____________5.9_____________68.0___________(11.4)
Colorado Springs.._______6.4_____________71.1___________(9.0)
Fort Wayne..___________6.8_____________68.9___________(11.4)
Deltona..______________FLA____________FLA___________(FLA)
Lakefield.._____________FLA____________FLA___________(FLA)
Johnston City.._________6.3______________57.5___________(21.4)
Lexington..____________4.9______________68.1___________(9.8 )
Augusta..______________7.3_____________61.7___________(18.4)
Palm Beach..___________FLA_____________FLA__________(FLA)
Lancaster.._____________3.6_____________67.0___________(10.3)
Chattanooga..__________7.5_____________64.8___________(15.8 )
Des Moines..___________4.2_____________73.8___________(4.4)
Kalamazoo..___________8.9_____________68.0___________(14.2)
Lansing..______________6.1_____________65.0___________(14.4)
Modesto.._____________9.8_____________62.2___________(20.0)
Cape Coral..___________FLA____________FLA___________(FLA)
Jackson, MI..__________9.0______________59.0___________(22.2)
Boise City..___________5.4______________67.8___________(11.1)
Madison.._____________3.6_____________73.7___________(3.9)
Spokeane..____________6.1_____________64.4___________(14.9)
Pensacola..____________6.1_____________61.4___________(17.7)
Toro @ Sat Mar 01, 2008 7:58 pm
This is an exaggeration.
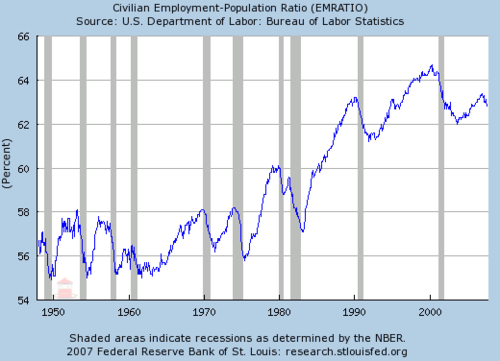
Though unemployment is rising, the participation rate - which is the ratio of those employed to the entire population - is still about 1% from its all-time highs.
I am at ground zero of the housing/subprime debacle here in Florida. We are definitely in a recession in this state. However, I still see signs for employment at fast food places and grocery stores. You didn't see any of those in 1991/92 when there was a recession in Canada.
Bruce_the_vii @ Sun Mar 02, 2008 12:53 am
It's true what you say, the participation rate is as high as it's ever been. However the participation rate in the best cities is 10% higher than what is normally regarded as full employment. Explain that.
The participation rate has been trending up for decades. I don't think economists realize that it would actually go higher in modern situation of both spouces working if it was possible.
(The chart above graphs the working population of people aged 16 and over, not the entire population. The label is misleading.)
danikyvor @ Sun Mar 02, 2008 1:26 am
Why is this in the Improve Canada thread?
Bruce_the_vii @ Sun Mar 02, 2008 1:30 am
Canadian statistics are the same as the American ones. The best cities have unemployment rates of 10 points higher than what is consider full employment. I thought posters would be interested in the USA data especially as it's a second indicator that Canada could perform much better.
Bruce_the_vii @ Sun Mar 02, 2008 1:32 am
I'm not exagerating. I did my calculations from the best three cities in the USA which have posted 74% participation. However there is one instance of even higher participation, the Toronto suburbs posted a whopping 79.2% in August of 1990 - implying you could add another 5% to all the above figures. The participation level is a changing.
Bruce_the_vii @ Sun Mar 02, 2008 1:45 am
If you could get participation up in the main Canadian cities you would have more money to spend. You could pay down the debt, spend more on social programs and give a tax cut at once. So it's important to explain why people are working in best cities. America and other Western countries are in the same participation boat as us.
mixedfarmer @ Sun Mar 02, 2008 1:53 am
most of saskatchewan and alberta have a manpower shortage. oil workers, welders, construction and health care are all short of personal. saskatchewan is just now recruiting 300 phillipino nurses.
Bruce_the_vii @ Sun Mar 02, 2008 2:22 am
Correct. Southern Alberta is the only place in N. America with full employment. Participation is 76% in Calgary but this is skewed upward by the fact the population there is younger than the national average. The construction industry is booming but the construction industry always seems to have problems staffing because it's rough work. The health care problem is because it takes four years to train as a nurse so this requires some planning by everyone involved. And money.
The participation level in Calgary is 76% but people take time to get back into the labour force so I'm watching to see if it goes up. Other places to watch would be Red Deer and Lethbridge. Statistics Canada does not have good data on these smaller places.
In particular what is of interest to me is if the defacto minimum wage goes up. I'd be interest in what the anecdotal information on what Tim Hortons and peers are paying in S. Alberta and Saskatchewan.
Toro @ Sun Mar 02, 2008 6:24 am
Bruce_the_vii Bruce_the_vii:
It's true what you say, the participation rate is as high as it's ever been. However the participation rate in the best cities is 10% higher than what is normally regarded as full employment. Explain that.
The participation rate has been trending up for decades. I don't think economists realize that it would actually go higher in modern situation of both spouces working if it was possible.
(The chart above graphs the working population of people aged 16 and over, not the entire population. The label is misleading.)
What do you regard as "best cities?" And what do you mean by "normally regarded as full employment?"
The participation ratio has not been trending up for decades. It began trending up in the late 70s as more women entered the workforce. It has been moving sideways since the late 1980s.
Bruce - and those are interesting statistics you posted above - at the very top of the graph in the late 1990s, firms were setting up recruiting tables outside of prisons, firms were so short of labour. They would try to hire people as prisoners were being released. I remember driving around Atlanta in the late 1990s with huge billboards begging for construction workers. But the difference between then and now for those in and out of the workforce is not great.
Bruce_the_vii @ Sun Mar 02, 2008 8:19 am
Thank you for responding.
The “best cities” is the three benchmark cities I listed at the top of my table. They are ahead of the rest of America in terms of getting people into jobs.
The unemployment in America is 5% to 6% currently while full employment is considerer 3% in Economics 101. So the USA is that close (or distant) from full employment. That’s my use of the term.
The anecdotes you mention may not be useful. That some HR guy talked his boss into hiring directly out of prison may be a red herring. Similarly the construction industry always seems to have a tough time finding people to work at the rough jobs they offer. A good indicator is if all the small retail shops around can’t find staff and have red help wanted signs out.
The chart you posted show participation rising over 30 years. I have no idea why you said it didn’t.
All that said you are right and I agree the data may not be solid. Some cities may not do as well as the best ones listed. I call myself a jobs activist and my considered response to that is the upper level of the labour force should be tested for by delaying immigration to Just-in-Time.
The data is interesting as you say and I have no trouble convincing people at large that there’s problems the government is ignoring.
Benoit @ Sun Mar 02, 2008 8:39 am
Bruce_the_vii Bruce_the_vii:
the official unemployment figure is not reliable because in the modern situation people drop out of the labour force.
Like any market, improving the labor market means improving its flexibility. Unemployment statistics is a measure of the pressure toward equilibrium. Unemployment is a surplus that disappears when wages decrease.
Bruce_the_vii @ Sun Mar 02, 2008 8:45 am
If wages went down so would consumption the supply and demand interpretation is somehow a little too much like expert rationaliztion.
Wages do not respond to supply and demand either. Economists call them "stickie". They're stickie for a good reason, employment at the best firms is a life time committment and the ups and downs of the market not the measure.
Benoit @ Sun Mar 02, 2008 8:53 am
Bruce_the_vii Bruce_the_vii:
If wages went down so would consumption
No, if wages would decreased so would the prices of what is consumed.
Bruce_the_vii @ Sun Mar 02, 2008 9:12 am
Well that's still expert rationalization. The Central Banks are afraid of declining prices, deflation, as it sets a recession in motion. The USA had a deflation scare in 2001 and everyone was pleased to see huge government deficits to boost consumption.