NASA: Polar Ice coverage the same as in 1979
DrCaleb @ Mon Jun 01, 2015 6:40 am
N_Fiddledog N_Fiddledog:
I did look, and damn...I posted the same graph twice. I meant to also show you this one.

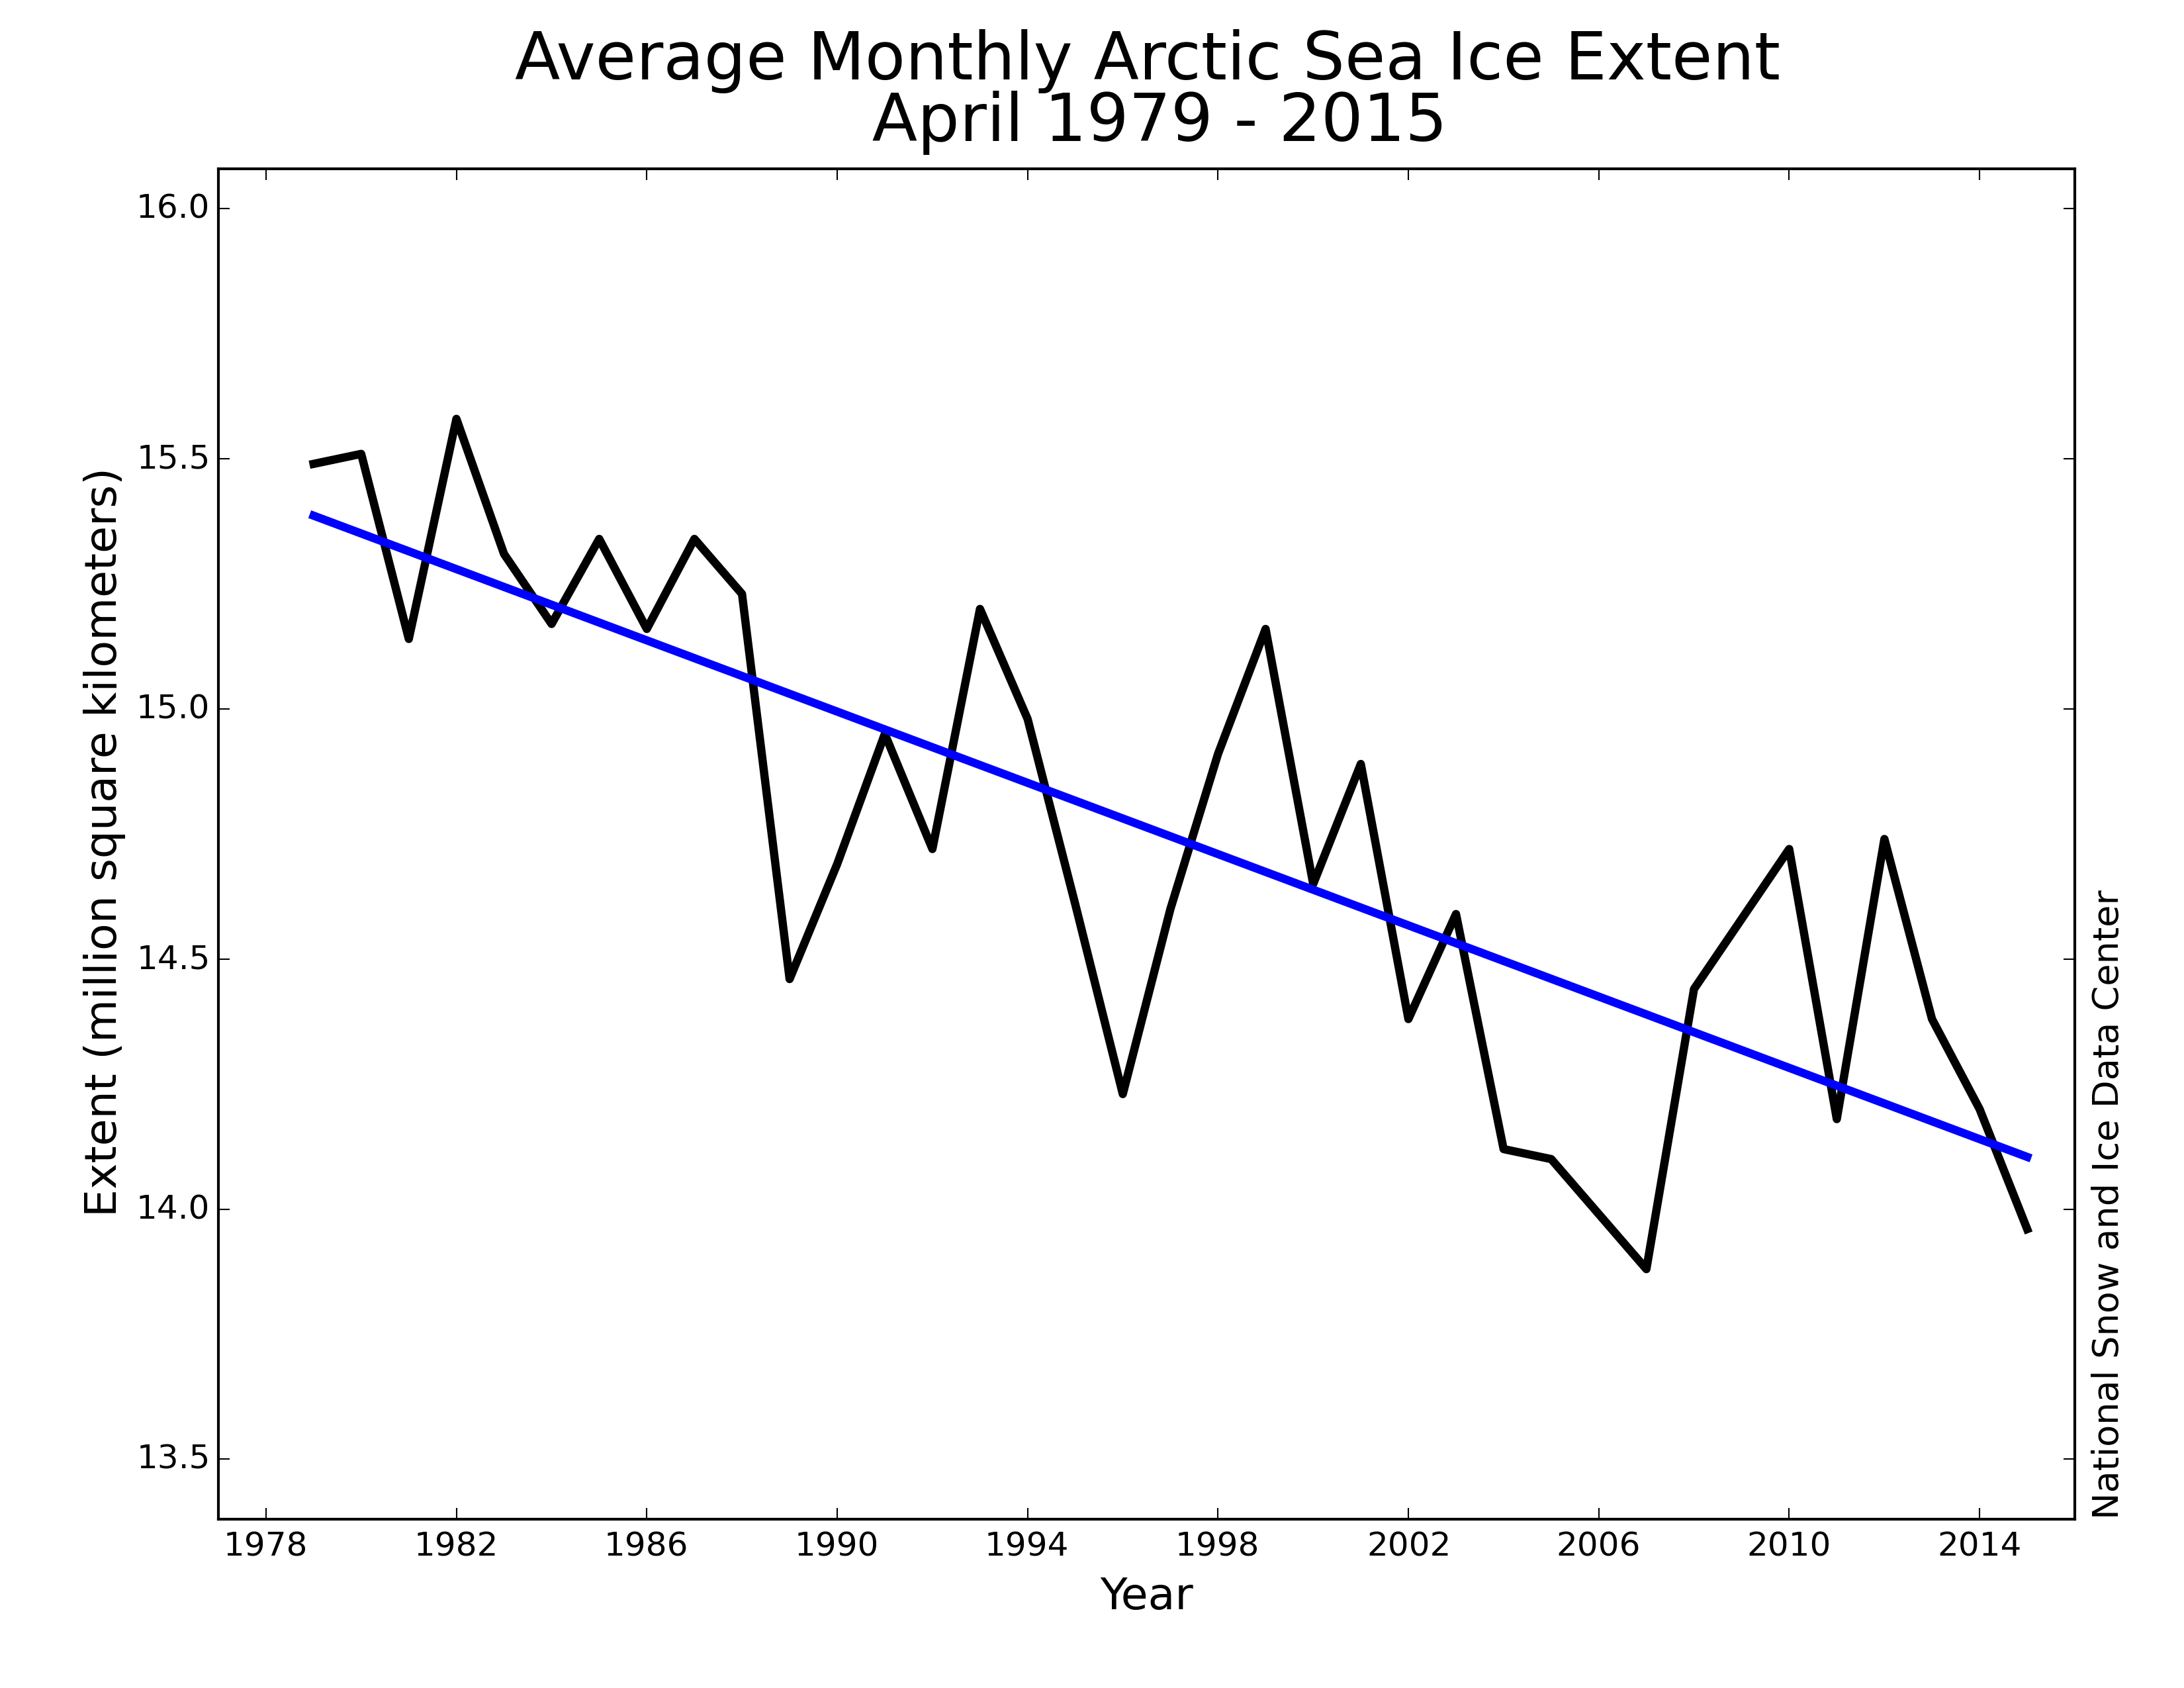
So now we have two to look at that are the same thing only displaying it differently - global ice extent over the satellite record of 35 years or so.
Now I don't see exactly what you see. I see extent as trending more or less less level until about 2001, then there's an obvious dip until about 2012, then up it goes again.
If I had to guess what the overall 35 year trend would be I'd actually agree with you and guess down, but I'd also guess the trend would be slight. Hardly noticeable would be my guess.
It doesn't matter though, because what the writer said was, "Updated data from NASA satellite instruments reveal the Earth’s polar ice caps have not receded at all since the satellite instruments began measuring the ice caps in 1979. Since the end of 2012, moreover, total polar ice extent has largely remained above the post-1979 average."
The second sentence there is definitely true. Shall we debate the first? It's going to be a little difficult to know what's actually happening there to a mathematical exactitude without trend lines. Got some?
Even to the naked eye though, I don't see anything that horrific one way or the other.
Which is where the cherry picking comes in. I'm really surprised at you N_F. You study this stuff more than anyone else, and you should have picked up on this obvious lie.
Yes, there is very little change in 'Ice Extent' or surface are since 1979 (if you consider 1 million square km in winter and 2 million square km in summer to be "little"), but if you look at the NASA site that the graph came from, you will see another graph:
http://arctic.atmos.uiuc.edu/cryosphere/
http://arctic.atmos.uiuc.edu/cryosphere ... series.jpg (not embedded, because of it's size). It's pretty obvious that there is a downward trend here. The maximums are not as high as the year before, and the minimums are lower.
Let's look at 100 years, shall we?

Let's look at the average of that data, but choose a range that shows the highs and lows more clearly:
It's also clear that the rate of change is also accelerating:

People can even watch for themselves the yearly changes since 1979, and see the coverage lessen with each passing season:
http://arctic.atmos.uiuc.edu/cryosphere ... 8-2006.mov
And when we look at another dimension, the 3rd, we see that the thickness is also falling faster than Danish scientists falling through late winter lake ice.
Using predictions based on observations, the outlook isn't very rosy. So, technicaly the 'ice extent' is not dramatically changing - the volume of actic ice is changing very dramatically.
And all of this is ignoring observations from people who are actually there, and have been living there for sometimes 80 years. They are seeing how things are changing, and James Taylor completely whitewashes these facts by presenting data as showing some trend it does not show.
It's easy to fool people who may not be able to read a graph into believing whatever someone wants them to. James Taylor is good at that. But he makes some very easy mistakes to refute.
http://www.atmos.illinois.edu/~wlchapma ... sponse.pdf
To say the Arctic Ice coverage now is the same as in 1979 is a lie, and to only discuss the surface area when the volume is so dramatically reduced is dishonest.
N_Fiddledog @ Mon Jun 01, 2015 7:15 am
But Doc how many times do you have to be told Taylor claims were "global". Yours are confined to the arctic. He is adding arctic and antarctic together to speak of Global Ice Extent.
None of the graphs you posted have anything to do with what he claimed. Yes extent for the arctic is way down, but he didn't claim it wasn't. He claimed "total" ice extent was no different now than it was when records were first began. When you add the record ice increases of the antarctic to the decreases of the arctic, nothing too scary is happening.
Oh, and hey, here's a question I have just because I'm interested, but not because it has anything to do with anything.
You post a hundred year record of arctic ice extent. How would they even have data for that? Where would they get it? Is it proxy data. Is it extrapolated from small bits of data where records were available for Northern Hemisphere land records? Is it modeled?
DrCaleb @ Mon Jun 01, 2015 7:26 am
N_Fiddledog N_Fiddledog:
But Doc how many times do you have to be told Taylor claims were "global". Yours are confined to the arctic. He is adding arctic and antarctic together to speak of Global Ice Extent.
None of the graphs you posted have anything to do with what he claimed. Yes extent for the arctic is way down, but he didn't claim it wasn't. He claimed "total" ice extent was no different now than it was when records were first began. When you add the record ice increases of the antarctic to the decreases of the arctic, nothing too scary is happening.
None of the graphs you posted have anything to do with what he claimed. Yes extent for the arctic is way down, but he didn't claim it wasn't. He claimed "total" ice extent was no different now than it was when records were first began. When you add the record ice increases of the antarctic to the decreases of the arctic, nothing too scary is happening.
So, the ice in the Antarctic is thickening? If not, then Arctic reduction means overall global reduction.
We've already discussed how Antarctic sea ice is increasing because of freshwater runoff, so unless the Antarctic ice is thickening and I missed that memo, then Polar Ice Coverage is not the same as in 1979.
Besides, I already know that Antarctic Glacial ice is starting to melt at record rates.
http://www.esa.int/Our_Activities/Obser ... _Peninsula
Edit: and that PDF link I posted did deal exactly with Global Ice Extents. Nice try though!
N_Fiddledog N_Fiddledog:
Oh, and hey, here's a question I have just because I'm interested, but not because it has anything to do with anything.
You post a hundred year record of arctic ice extent. How would they even have any data for that? Where would they get it? Is it proxy data. Is extrapolated from small bits of data where records were available? Is it modeled?
You post a hundred year record of arctic ice extent. How would they even have any data for that? Where would they get it? Is it proxy data. Is extrapolated from small bits of data where records were available? Is it modeled?
Really? Tug on the other one.
N_Fiddledog @ Mon Jun 01, 2015 7:47 am
DrCaleb DrCaleb:
N_Fiddledog N_Fiddledog:
Oh, and hey, here's a question I have just because I'm interested, but not because it has anything to do with anything.
You post a hundred year record of arctic ice extent. How would they even have any data for that? Where would they get it? Is it proxy data. Is extrapolated from small bits of data where records were available? Is it modeled?
You post a hundred year record of arctic ice extent. How would they even have any data for that? Where would they get it? Is it proxy data. Is extrapolated from small bits of data where records were available? Is it modeled?
Really? Tug on the other one.
No, seriously. I'd seriously like to know where a hundred year record for Arctic ice extent comes from. I've seen the claims around from time to time, but I've never received a satisfactory answer on what data was used.
I have to suspect you guys who make the claims don't actually know where the data comes from.
DrCaleb @ Mon Jun 01, 2015 8:07 am
N_Fiddledog N_Fiddledog:
DrCaleb DrCaleb:
N_Fiddledog N_Fiddledog:
Oh, and hey, here's a question I have just because I'm interested, but not because it has anything to do with anything.
You post a hundred year record of arctic ice extent. How would they even have any data for that? Where would they get it? Is it proxy data. Is extrapolated from small bits of data where records were available? Is it modeled?
You post a hundred year record of arctic ice extent. How would they even have any data for that? Where would they get it? Is it proxy data. Is extrapolated from small bits of data where records were available? Is it modeled?
Really? Tug on the other one.
No, seriously. I'd seriously like to know where a hundred year record for Arctic ice extent comes from. I've seen the claims around from time to time, but I've never received a satisfactory answer on what data was used.
I have to suspect you guys who make the claims don't actually know where the data comes from.
Please! You know exactly where they came from - observation. The same thing that Science has done since the dawn of time. This information is on all of the popular climate sites, so you are tugging on my balls if you expect me to believe that you haven't read it before.
Ships have been sent for decades to map this information, and many famous people like Charles Lindbergh also carried out observations of the ice extents before we had satellites to do it.
http://wattsupwiththat.com/2009/06/20/h ... rctic-ice/
Ships still are sent, in many cases. As are aircraft.
N_Fiddledog @ Mon Jun 01, 2015 8:58 am
DrCaleb DrCaleb:
So, the ice in the Antarctic is thickening? If not, then Arctic reduction means overall global reduction.
We've already discussed how Antarctic sea ice is increasing because of freshwater runoff, so unless the Antarctic ice is thickening and I missed that memo, then Polar Ice Coverage is not the same as in 1979.
Besides, I already know that Antarctic Glacial ice is starting to melt at record rates.
http://www.esa.int/Our_Activities/Obser ... _Peninsula
Edit: and that PDF link I posted did deal exactly with Global Ice Extents. Nice try though!
I did miss that PDF. All I saw were those alarmist upward graphs with the line zooming upwards, and I thought to myself, 'oh well, guess he doesn't know any better', but it turns out you did. You did know Taylor was talking specifically about global ice extent, not just Arctic. Yet you chose to hammer away with a deceptive section of data implying it represented the whole, then accused me of cherry-picking. That's almost amusing.
But whatever...let's get to facts.
Yes there is a peninsula jutting up from the Arctic towards the tropics. And that section did appear to start warming as a result of tropical currents pushing farther south in 2009. Didn't affect the recent record large Antarctic ice extents of the total continent though.
You tell me you believe the record increases are caused by freshwater runoff. I imagine there are multiple theories, but actually to my untrained mind that sounds like a decent one. Doesn't matter though. My only point is Taylor wasn't lying, and a freshwater runoff theory doesn't show he was.
As to ice thickness in the Antarctic, yeah, what is the story there, anyway? How would they measure that one? In the arctic I hear the word "Piomass". Is there something similar for the Antarctic. I remember something about them using planes in the warmer sections of the Western Antarctic where there's stations. Are there also satellite measurements? What do they show?
Now on your PDF where the guy criticises Taylor's article. He's one of a few making critiques. Taylor addresses them here.
The Climate Alarmists’ Latest Argument About Polar Ice – And Why It’s Wrong
The strongest argument I saw in your PDF was the graph where he claimed a 5% increase in decrease of ice extent over the 35 year satellite record.
In his response Taylor says:
$1:
the objective polar sea ice data, linked here and explained in my Forbes.com column, show “the polar ice caps remained at approximately their 1979 extent until the middle of the last decade. Beginning in 2005, however, polar ice modestly receded for several years. By 2012, polar sea ice had receded by approximately 10 percent from 1979 measurements. (Total polar ice area – factoring in both sea and land ice – had receded by much less than 10 percent, but alarmists focused on the sea ice loss as “proof” of a global warming crisis.) A 10-percent decline in polar sea ice is not very remarkable, especially considering the 1979 baseline was abnormally high anyway. … In late 2012, however, polar ice dramatically rebounded and quickly surpassed the post-1979 average. Ever since, the polar ice caps have been at a greater average extent than the post-1979 mean.”
You don’t have to take my word for it, you can see it for yourself in the data. Yes, there was a very modest decline from 2005-2012, but polar ice extent has averaged above the long-term mean since 2012. NASA and the University of Illinois’ Polar Research Group may argue polar sea ice may decline again in the future, but such self-serving speculation does not rebut the objective truth that polar ice extent has averaged above the long-term mean since 2012.
You don’t have to take my word for it, you can see it for yourself in the data. Yes, there was a very modest decline from 2005-2012, but polar ice extent has averaged above the long-term mean since 2012. NASA and the University of Illinois’ Polar Research Group may argue polar sea ice may decline again in the future, but such self-serving speculation does not rebut the objective truth that polar ice extent has averaged above the long-term mean since 2012.
So Taylor is claiming the actual increase of the decrease only occurred during a 7 year section of the 35 year record. Stretched over 35 years 10% becomes 5. I imagine that's what he's claiming anyway. To be honest I was impressed it was 5. That's higher than I would have expected based on just the eye view.
N_Fiddledog @ Mon Jun 01, 2015 9:07 am
DrCaleb DrCaleb:
Please! You know exactly where they came from - observation. The same thing that Science has done since the dawn of time. This information is on all of the popular climate sites, so you are tugging on my balls if you expect me to believe that you haven't read it before.
Ships have been sent for decades to map this information, and many famous people like Charles Lindbergh also carried out observations of the ice extents before we had satellites to do it.
http://wattsupwiththat.com/2009/06/20/h ... rctic-ice/
Ships still are sent, in many cases. As are aircraft.
Ships have been sent for decades to map this information, and many famous people like Charles Lindbergh also carried out observations of the ice extents before we had satellites to do it.
http://wattsupwiththat.com/2009/06/20/h ... rctic-ice/
Ships still are sent, in many cases. As are aircraft.
I haven't finished reading the article in your link yet, but my first question would be why on earth would you post it? Did you read it? Did you not think I would? So far it doesn't appear to show what you want it to.
From the 3rd paragraph:
"Few external ‘official ‘instrumental records exist for this period-or are sporadic in area or time scale- so observations made at the time and place are important to our understanding as to what happened to arctic ice and temperatures in this era. This article has two converging themes; the search for the North West passage and the scientific explorations of the region by a former whaler."
Benn @ Mon Jun 01, 2015 10:06 am
I prefer dwelling on this graph? Tell me its not better than your guys'
Zipperfish @ Mon Jun 01, 2015 10:15 am
N_Fiddledog N_Fiddledog:
In his response Taylor says:
$1:
the objective polar sea ice data, linked here and explained in my Forbes.com column, show “the polar ice caps remained at approximately their 1979 extent until the middle of the last decade. Beginning in 2005, however, polar ice modestly receded for several years. By 2012, polar sea ice had receded by approximately 10 percent from 1979 measurements. (Total polar ice area – factoring in both sea and land ice – had receded by much less than 10 percent, but alarmists focused on the sea ice loss as “proof” of a global warming crisis.) A 10-percent decline in polar sea ice is not very remarkable, especially considering the 1979 baseline was abnormally high anyway. … In late 2012, however, polar ice dramatically rebounded and quickly surpassed the post-1979 average. Ever since, the polar ice caps have been at a greater average extent than the post-1979 mean.”
You don’t have to take my word for it, you can see it for yourself in the data. Yes, there was a very modest decline from 2005-2012, but polar ice extent has averaged above the long-term mean since 2012. NASA and the University of Illinois’ Polar Research Group may argue polar sea ice may decline again in the future, but such self-serving speculation does not rebut the objective truth that polar ice extent has averaged above the long-term mean since 2012.
You don’t have to take my word for it, you can see it for yourself in the data. Yes, there was a very modest decline from 2005-2012, but polar ice extent has averaged above the long-term mean since 2012. NASA and the University of Illinois’ Polar Research Group may argue polar sea ice may decline again in the future, but such self-serving speculation does not rebut the objective truth that polar ice extent has averaged above the long-term mean since 2012.
How does he know that 1979 was abnormally high?
N_Fiddledog @ Mon Jun 01, 2015 10:30 am
Zipperfish Zipperfish:
How does he know that 1979 was abnormally high?
Ya got me...
The article Doc gave me to read is telling me there were melting periods in the Arctic in the past. Maybe Taylor agrees with Doc and thinks such scattered reports offer some sort of comprehensive record of Arctic ice extents.
DrCaleb @ Mon Jun 01, 2015 10:48 am
N_Fiddledog N_Fiddledog:
You tell me you believe the record increases are caused by freshwater runoff. I imagine there are multiple theories, but actually to my untrained mind that sounds like a decent one. Doesn't matter though. My only point is Taylor wasn't lying, and a freshwater runoff theory doesn't show he was.
My point was that Taylor was cherry picking the graph in order to claim a trend that isn't there. Surface extent may not be changing 'significantly' (what's a few million square km here or there?) but overall ice mass is changing significantly. An intentional omission is still a lie.
N_Fiddledog N_Fiddledog:
I haven't finished reading the article in your link yet, but my first question would be why on earth would you post it? Did you read it? Did you not think I would? So far it doesn't appear to show what you want it to.
From the 3rd paragraph:
"Few external ‘official ‘instrumental records exist for this period-or are sporadic in area or time scale- so observations made at the time and place are important to our understanding as to what happened to arctic ice and temperatures in this era. This article has two converging themes; the search for the North West passage and the scientific explorations of the region by a former whaler."
It shows exactly what I wanted it to. Just because Galileo, Copernicus or Newton didn't have the accurate data that we have now, it doesn't mean their work isn't significant. Whether the data was gathered by whalers or aircraft, it doesn't change the data that we've gathered since we started using satellites with fine tolerances. The trend we see in the long term data also isn't impacted.
I'd expect a denier blog to use the 'there is no data' line of fallacious reasoning, not you N_F.
PluggyRug @ Mon Jun 01, 2015 11:51 am
Do any of you guy's think Chandlers Wobble could be having an effect on the polar regions?
DrCaleb @ Mon Jun 01, 2015 12:10 pm
PluggyRug PluggyRug:
Do any of you guy's think Chandlers Wobble could be having an effect on the polar regions?
I haven't seen any serious typing devoted to any effect that the wobble could have on the relatively sudden change in climate we've recorded. What I have seen puts the effect at less than the average volcano.
Zipperfish @ Mon Jun 01, 2015 12:15 pm
PluggyRug PluggyRug:
Do any of you guy's think Chandlers Wobble could be having an effect on the polar regions?
And vice versa. The north pole is also moving quite quickly right, and we may be in for a polarity shift soon.
bootlegga @ Mon Jun 01, 2015 12:19 pm
N_Fiddledog N_Fiddledog:
Well you have to go back a lot of years to find out who started the name calling and it gets kind of childish (even though it was you guys 
 )
)
Poppycock, you Bart started the name-calling in this thread and you're fake outraged that I responded in kind.
Those who live in glass houses and all that...
$1:
Now this is going to surprise you, but believe it or not there are those who are not thinking "My, what a witty retort", when they see something like that, or something like somebody jumping into a conversation with little more than a name-call of "Denier".
No...really.
No...really.
Re-read my post, I didn't call either of you a denier, I called Bart's spurious source (and the organization he works for) a denie, which by all but the most partisan he and Heartland are.
I know, the truth hurts sometimes!